Quick Gantt
by SheetKitty 🐾
Turn your existing spreadsheet data into colour-coded, interactive Gantt charts — without leaving Google Sheets, without exports, and without any templates.
No templates, no reformatting. Quick Gantt reads the columns you already have and builds your timeline around them in four steps.
Install from Marketplace
Open Google Sheets → Extensions → Add-ons → Get add-ons. Search Quick Gantt by SheetKitty and install.
Prepare Your Columns
Your sheet needs Planned Start/End, Actual Start/Finish, % Complete, a colour column, and a Data Date cell.
Select Your Date Range
Highlight cells from your first Planned Start to your last Planned End date across all task rows.
Run & Get Your Chart
Click ⚡ Quick Gantt → Create Gantt from Selection, answer 5 questions, and your timeline appears instantly.
When you run Create Gantt from Selection, a quick wizard asks you to map your columns by letter. Here's what each question means.
| Question | What to type | Example |
|---|---|---|
| 1 of 5 Color Column | Column letter where your task background colours live | A |
| 2 of 5 Actual Start | Column letter for when work actually began | E |
| 3 of 5 Actual Finish | Column letter for when work actually ended | F |
| 4 of 5 % Complete | Column letter with progress as a decimal (0.75 = 75%) | G |
| 5 of 5 Data Date Cell | Full cell reference for your reporting cut-off date | B2 |
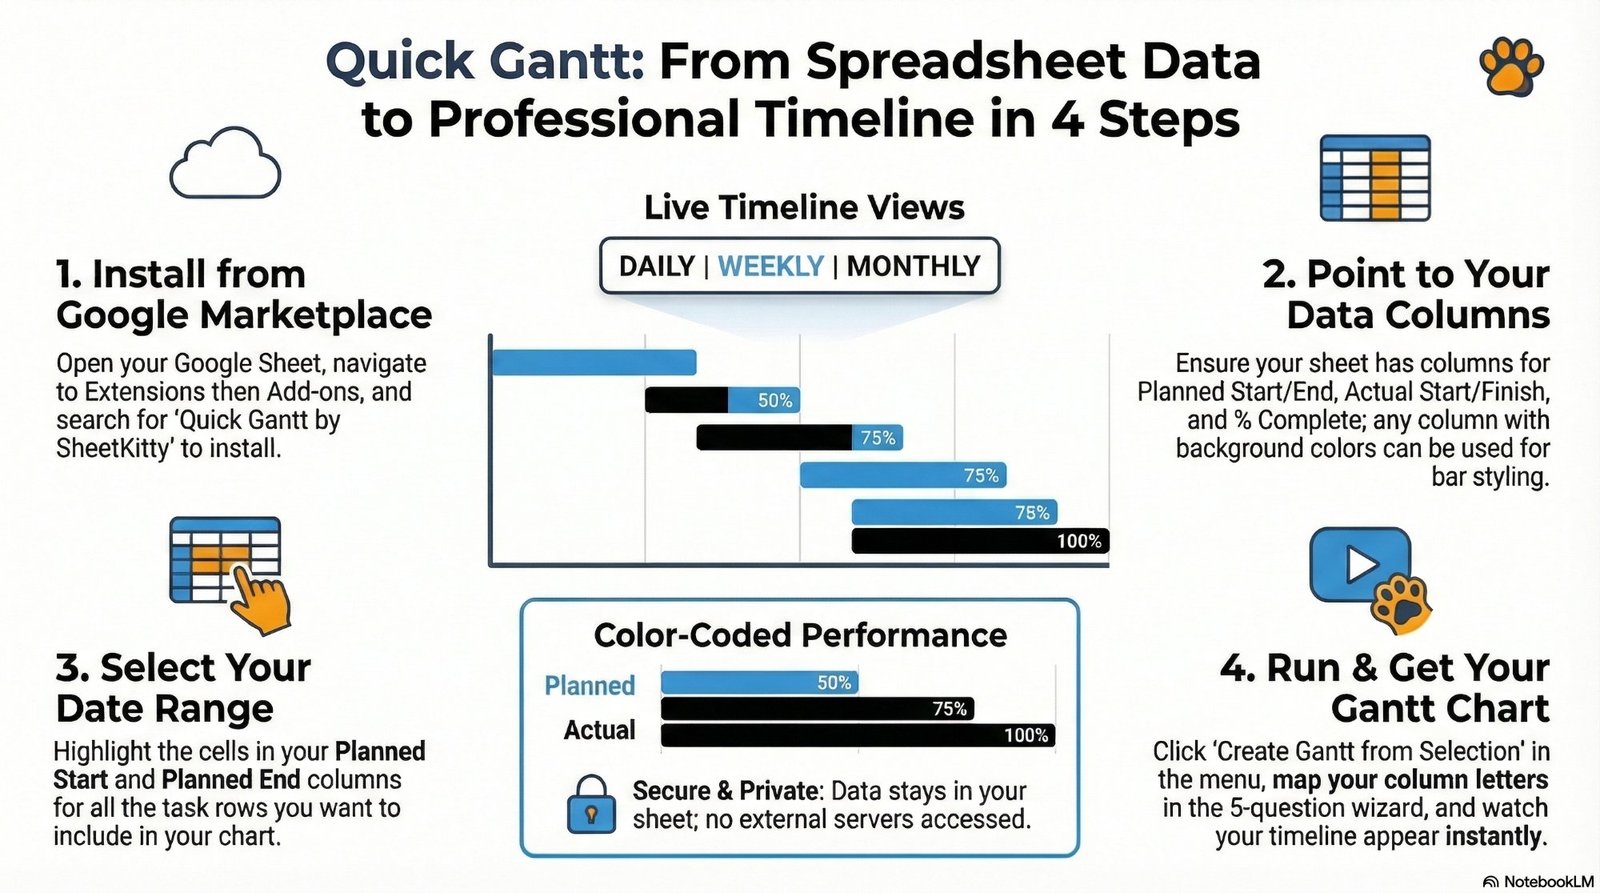
From spreadsheet data to a professional project timeline — the full picture in one view.
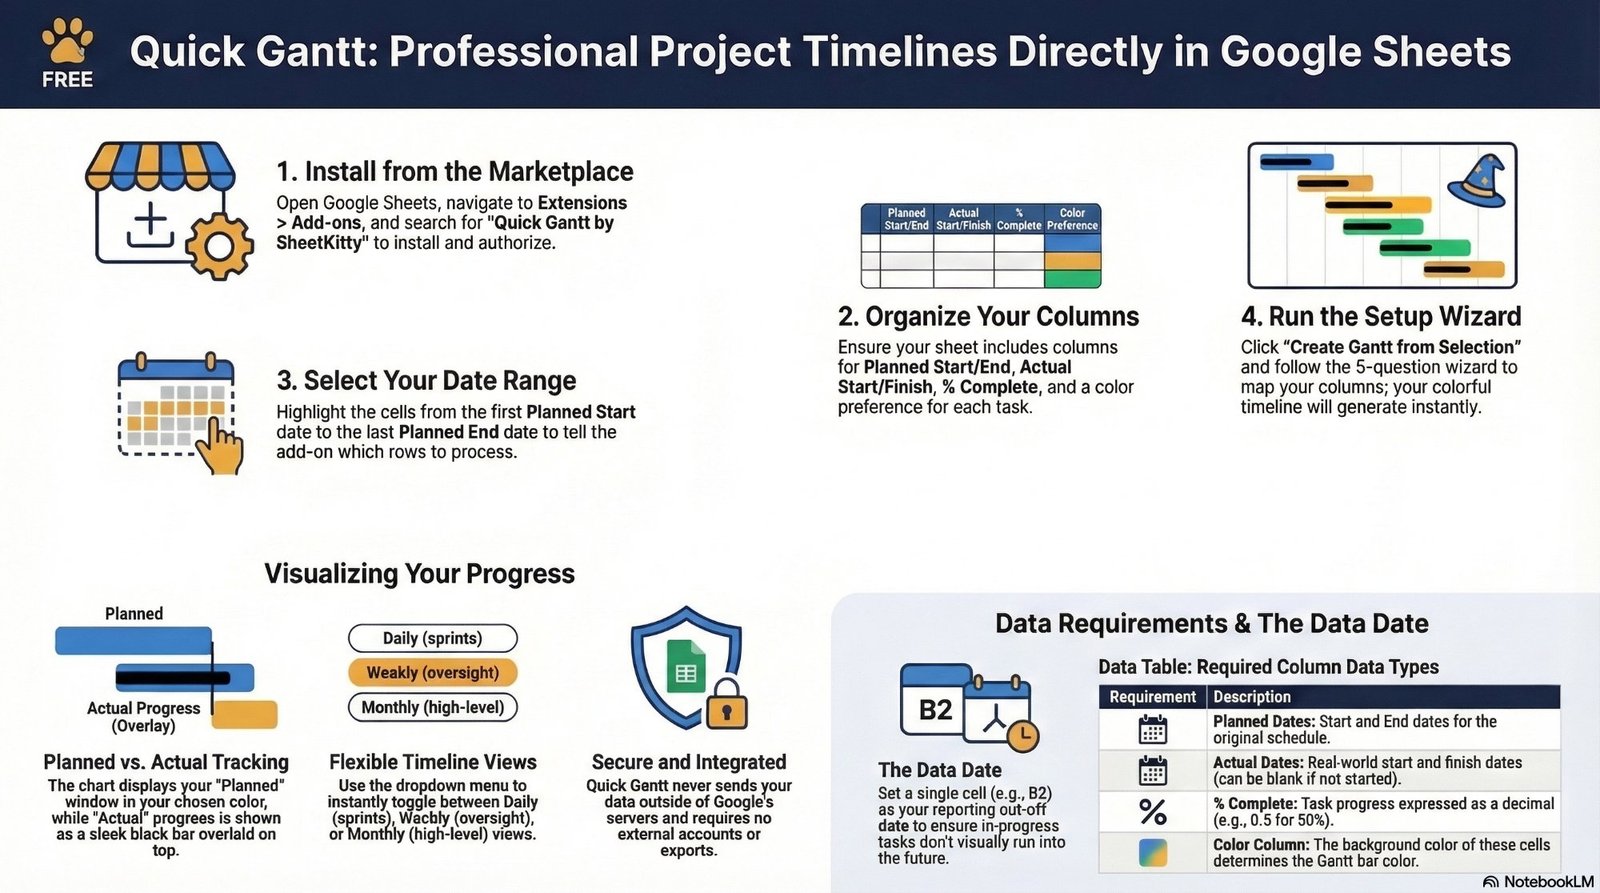
Planned vs actual tracking, flexible timeline views, the Data Date concept, and data requirements — all in one place.
Ready to build your first Gantt chart?
Free forever. No account needed. Installs directly into Google Sheets in under a minute.